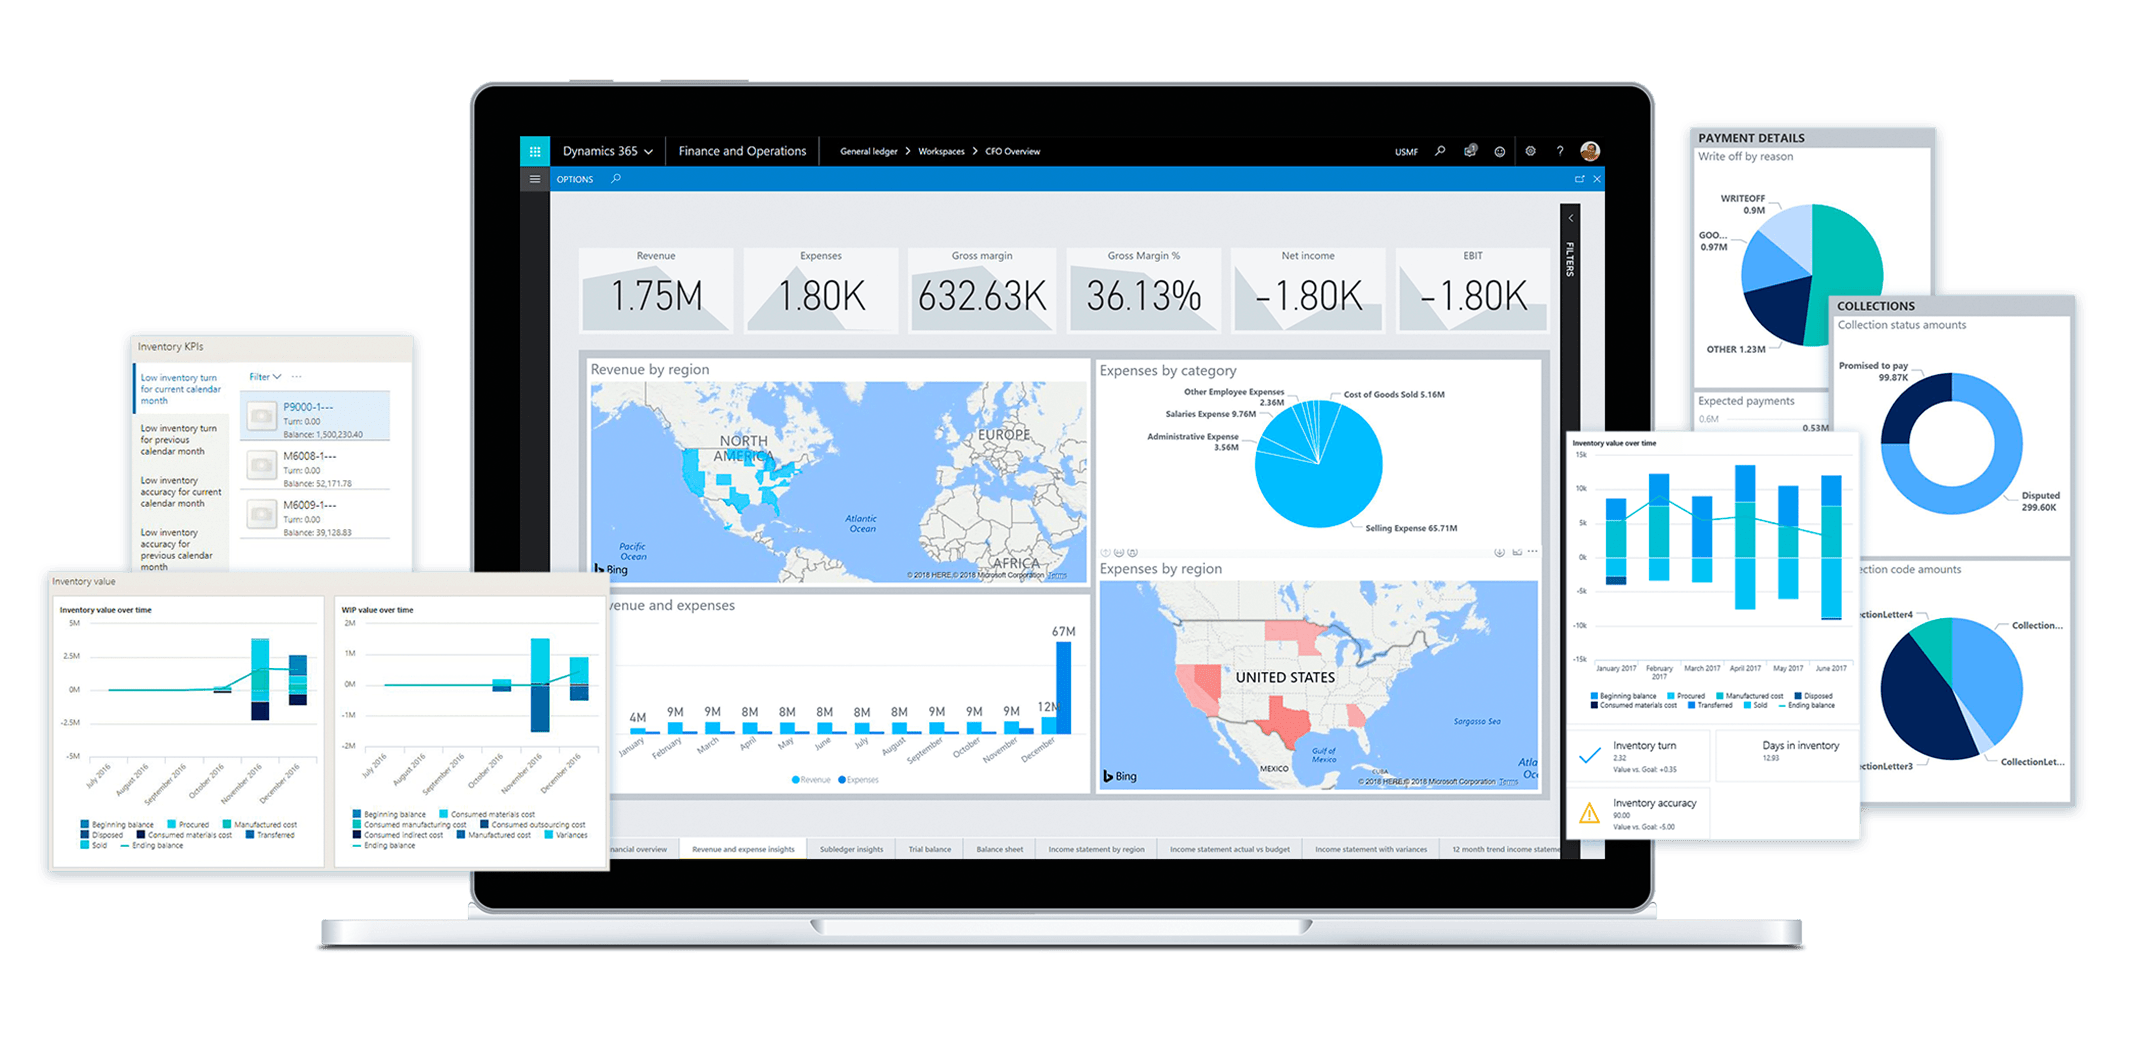
Tech Ventures offers an advanced Business Intelligence (BI) suite, equipping businesses with visually compelling and interactive tools designed for comprehensive data analysis and statistical evaluation. Additionally, our BI solution encompasses robust reporting capabilities, empowering users to efficiently monitor and manage software utilization and performance status.
Status reports
Status reports provide pre-designed business intelligence reporting for processes and applications, with the flexibility to create custom reports using BI tools without technical expertise. Control Points capture process information, while BAM displays process status, performers, input, and downtime. Chronometry offers time control options to define process duration and receive notifications for approaching or expired time limits. Additionally, group task visibility enables efficient task control and reallocation in bulk.
Business analytics reporting
Business analytics reporting leverages contextual data generated from application and process usage to provide valuable analytics insights. Examples of Business Intelligence include statistics that amalgamate data from various applications and processes, document library reports, and workload reports enabling real-time task visualization for efficient reassignment when needed.
Power BI Embedded
Power BI Embedded seamlessly incorporates Microsoft’s Power BI, enhancing reporting capabilities with several key advantages. It facilitates reporting for a wide range of users, both internal and external, eliminating the requirement for a dedicated Microsoft account. This integration also leads to cost savings through dedicated licensing, reducing management and operational expenses associated with Microsoft.
Data Collection
Collecting data from diverse sources like databases, spreadsheets, and external inputs.
Data Analysis
Employing analytical tools to scrutinize and interpret data, recognizing patterns, trends, and valuable insights.
Data Visualization
Representing data visually through charts, graphs, and dashboards to simplify complex information for better comprehension.
Reporting
Generating reports and summaries to convey insights to stakeholders across the organization.
Querying and Reporting Tools
Utilizing tools enabling users to query databases and create reports based on specific criteria.
Data Warehousing
Managing large datasets in a centralized repository for easy retrieval and analysis.
Performance Metrics and Key Performance Indicators (KPIs)
Establishing and tracking metrics aligned with organizational objectives to assess performance and achievements.
Generate, share, and disseminate insightful reports
Our business intelligence (BI) reporting solutions extracts valuable insights from data, aiding informed decisions and strategic planning.


